Crypto Currency

Bitcoin Set to Have Its Fourth Strongest Month Since October 2021

Markets Share Share this article Copy link X icon X (Twitter) LinkedIn Facebook Email Bitcoin Set to Have Its Fourth Strongest Month Since October 2021 Bitcoin is currently up over 36% for November, which has only been beaten by three other months since October 2021. By James Van Straten| Edited by Parikshit Mishra Nov 29

Markets

Share this article

X iconX (Twitter)LinkedInFacebookEmail

Bitcoin Set to Have Its Fourth Strongest Month Since October 2021

Bitcoin is currently up over 36% for November, which has only been beaten by three other months since October 2021.

By James Van Straten|Edited by Parikshit Mishra
Nov 29, 2024, 11:34 a.m. UTC
BTC: Long/Short Term On-Chain Cost Basis (Glassnode)

BTC: Long/Short Term On-Chain Cost Basis (Glassnode)

What to know:

  • Bitcoin’s 36% rise in November 2024, has only been beaten by three other months since October 2021.
  • The current bitcoin market structure has a similar set up to Q4 2020, which was the start of bitcoin’s bull run.

Nov. 30, is the last trading day of the month, so all eyes will be on bitcoin’s (BTC) monthly candle. Bitcoin is less than 4% away from the psychological wall of $100,000. While the $9 billion worth of options expiry for bitcoin has just expired, which has sent the token slightly higher on the day to over $96,000.

CoinGlass data shows that November has been one of the strongest months for bitcoin for several years, currently up over 36%, which would be the fourth best performing month since October 2021.

November’s rise has only been beaten thrice February 2024 (44%), January 2023 (40%) and October 2021 (40%). November’s impressive performance is largely due to the fact that Donald Trump won the U.S. presidential election earlier this month.

Yet, bitcoin still has two more days until the official monthly close so there is still time to beat these milestones.

On a quarterly timeframe, bitcoin is currently up 51% on the quarter with December still to come, on average the month of December returns around 5%. Q4 2024 has been the strongest quarter since Q1 which returned 69%.

BTC Monthly Performance (Glassnode)

BTC Monthly Performance (Glassnode)

It seems a matter of when not if, bitcoin breaks past $100,000 while it is on track towards an all-time high monthly close.

Analyst Caleb Franzen believes there is more juice left to squeeze in this current bitcoin bull market.

“BTCUSD monthly chart with the RSI indicator: Bitcoin bull markets often peak with the monthly RSI trading above 90, versus the current level of 75. Historically, we’ve seen each bull market peak with a lower RSI, illustrated by the descending trend line, Franzen says. The implication is that momentum is not yet “overheated” and that more upside can be squeezed out of this uptrend in the months/quarters ahead”.

BTCUSD monthly chart with the RSI indicator (Caleb Franzen)

BTCUSD monthly chart with the RSI indicator (Caleb Franzen)

Similar market structure to Q4 2020

Bitcoin is in a similar market structure to Q4 2020, both periods saw strong green months in October and November, with a correction during the 2020 Thanksgiving period. In the back end of 2020, this was when bitcoin conclusively left behind the psychological barrier of $10,000 and went to $60,000 by April 2021.

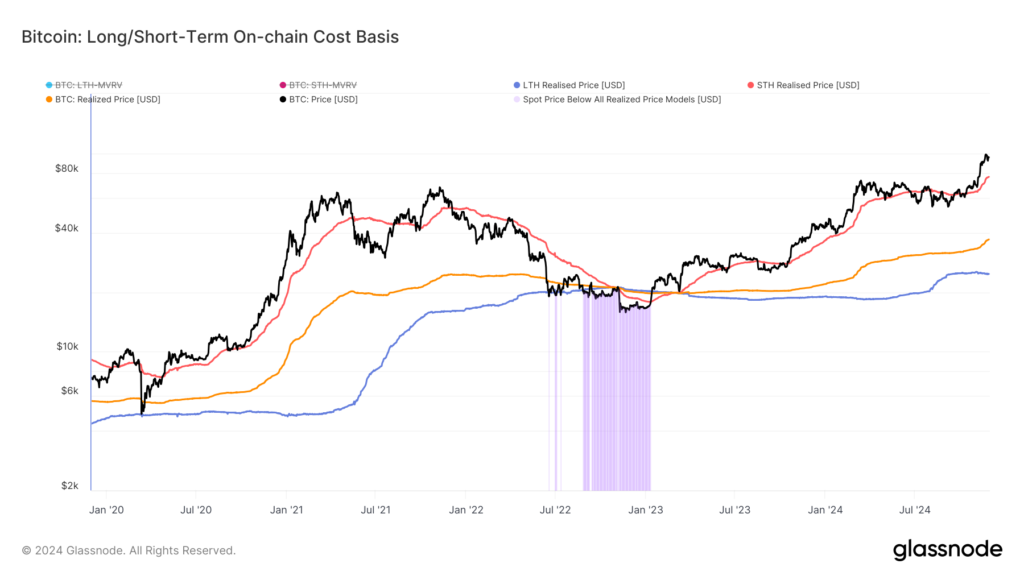
Glassnode data shows that when bitcoin is above the short-term holder’s realized price (STHRP) it tends to mean bitcoin is in a bull market. In Q4 2020, bitcoin used the STHRP consistently as a support level, as the price continued higher.

An expectation could be that bitcoin continues higher and using the STHRP as a support level mimicking Q4 2020. STHP reflects the average on-chain acquisition price for coins held outside exchange reserves, which were moved within the last 155 days. These reflect the most probable coins to be spent on any given day.

There is also a growing divergence between the realized price (which reflects the average on-chain acquisition price for the entire coin supply) and the long-term holder realized price (LTHRP) which reflects the average on-chain acquisition price for coins held outside exchange reserves, which have not moved within the last 155-days. These reflect the least probable coins to be spent on any given day.

A growing divergence tells us that new participants are entering the market while long-term holders are spending or realizing profits.

One very small data point indicates that bitcoin could even hit $100,000 on Nov. 29. Bitcoin first hit $1,000 on Nov. 27, 2013. Four years and one day later, bitcoin first hit $10,000. Could we see $100,000, just seven years and one day later?

James Van Straten

As the senior analyst at CoinDesk, specializing in Bitcoin and the macro environment. Previously, working as a research analyst at Saidler & Co., a Swiss hedge fund, introduced to on-chain analytics. James specializes in daily monitoring of ETFs, spot, futures volumes, and flows to understand how Bitcoin interacts within the financial system. James holds more than $1,000 worth of bitcoin, MicroStrategy (MSTR) and Semler Scientific (SMLR).

X icon

Picture of CoinDesk author James Van Straten

!–$–>!–$–>!–>!–>
Read More

Be the first to write a comment.

Leave a Reply

Your email address will not be published. Required fields are marked *

Crypto Currency

Can you pay your mortgage with crypto? Housing giant Fannie Mae’s new policy says yes — details here

Fannie Mae now accepts cryptocurrency as collateral for down payments, allowing homebuyers to leverage their digital assets without selling. Details here.&nbsp…

Fannie Mae now accepts cryptocurrency as collateral for down payments, allowing homebuyers to leverage their digital assets without selling. Details here.&nbsp…
Read More

Continue Reading
Crypto Currency

Buy a Home With Bitcoin: Coinbase, Fannie Mae Bring Crypto Mortgages to Mainstream Buyers

Bitcoin Magazine Buy a Home With Bitcoin: Coinbase, Fannie Mae Bring Crypto Mortgages to Mainstream Buyers Coinbase is partnering with Better Home & Finance to roll out bitcoin-backed mortgages backed by Fannie Mae. This post Buy a Home With Bitcoin: Coinbase, Fannie Mae Bring Crypto Mortgages to Mainstream Buyers first appeared on Bitcoin Magazine and

Bitcoin Magazine

Buy a Home With Bitcoin: Coinbase, Fannie Mae Bring Crypto Mortgages to Mainstream Buyers
Coinbase is partnering with Better Home & Finance to roll out bitcoin-backed mortgages backed by Fannie Mae.
This post Buy a Home With Bitcoin: Coinbase, Fannie Mae Bring Crypto Mortgages to Mainstream Buyers first appeared on Bitcoin Magazine and is written by Micah Zimmerman…
Read More

Continue Reading
Crypto Currency

Bitcoin price drops below $70,000 after Iran truce buzz, Network Activity weakens

Bitcoin price falls below $70,000 as network activity weakens. Declining transactions and addresses signal lower demand. Key support is at $69,400, while resistance stands near $71,600. Bitcoin price today hit a daily low of $69,914.54 after soaring above $71,000 at the start of the week, following news of a truce proposal to Iran by US


Bitcoin price drops below $7src,srcsrcsrc again

  • Bitcoin price falls below $70,000 as network activity weakens.
  • Declining transactions and addresses signal lower demand.
  • Key support is at $69,400, while resistance stands near $71,600.

Bitcoin price today hit a daily low of $69,914.54 after soaring above $71,000 at the start of the week, following news of a truce proposal to Iran by US President Donald Trump.

The sudden pullback has pushed Bitcoin back below the $70,000 level, a psychological zone that traders often watch closely for signs of strength or weakness.

This decline did not happen in isolation, as the underlying data suggests that the broader network is also losing momentum.

Bitcoin Network Activity signals weakening demand

Recent on-chain data shows that Bitcoin’s Network Activity Index continues to trend downward, pointing to a steady cooling in user participation.

This index tracks a combination of key metrics that together reveal how actively the network is being used daily.

Among these metrics are active addresses, which measure how many unique participants are sending or receiving Bitcoin.

A decline in active addresses often signals reduced interest or engagement from both retail users and larger players.

Transaction counts have also softened, indicating that fewer transfers are taking place across the network.

This drop in transaction activity suggests that demand for block space is easing, which usually aligns with quieter market conditions.

Another important indicator, the UTXO count, reflects how coins are being distributed and reused, and its slowdown points to less frequent movement of funds.

Block data, including the number of bytes per block, further confirms that network usage is not as intense as it was during more active periods.

Taken together, these signals paint a clear picture of declining demand rather than temporary disruption.

The BTC price struggles mirror on-chain weakness

The recent dip below $70,000 appears to be more than just a reaction to short-term news or macro headlines.

Instead, it reflects a broader lack of strong buying pressure needed to sustain higher price levels.

Even though Bitcoin managed to climb earlier in the week, the rally lacked the support of rising network activity.

This disconnect between price and usage often leads to corrections, as the market struggles to justify higher valuations.

Short-term performance data also shows mild losses across multiple timeframes, reinforcing the idea that momentum is fading.

While the market has not entered a sharp sell-off, the gradual decline suggests a slow shift in sentiment.

Investors seem to be taking a more cautious approach, with fewer participants actively entering the market.

At the sam

Read More

Continue Reading
Crypto Currency

Analyst Says Bitcoin Eyes $80K as Key Level Faces Breakout Pressure

Bitcoin tested $71,500 four times in seven days as an inverse head and shoulders pattern builds, with analysts split on whether the compression leads to a breakout or another failed rally. The post Analyst Says Bitcoin Eyes $80K as Key Level Faces Breakout Pressure appeared first on Crypto News Australia…

Bitcoin tested $71,500 four times in seven days as an inverse head and shoulders pattern builds, with analysts split on whether the compression leads to a breakout or another failed rally.
The post Analyst Says Bitcoin Eyes $80K as Key Level Faces Breakout Pressure appeared first on Crypto News Australia…
Read More

Continue Reading